Video Metrics That Predict Pipeline Impact for SaaS Teams
Link video viewing to specific contacts and accounts to reveal which plays actually drive pipeline.

A video dashboard can show 50,000 views and a completion rate that beats every internal benchmark, and none of it tells sales which of those views turned into a qualified opportunity. Most SaaS teams read that silence as a content failure and start rewriting scripts. The real gap is structural, sitting in the plumbing between the video platform and the CRM. A raw view count and a pipeline-qualified signal are not the same data, and most hosting setups only ever produce the first one. A public or unlisted video URL can confirm that a play event happened. It cannot say who triggered it. Forward that same link to three people on a buying committee and the dashboard reports three plays with no way to tell the champion's repeat viewing apart from a skeptical VP's five-second bounce⟧c4⟧.
The distinction that matters here is between "watched" and "attributed." Watched means a play event fired somewhere in an analytics tool. Attributed means that event is tied to a specific account, contact, or open opportunity inside the CRM. The distance between those two states is where most video programs stall.
That distance gets worse, not better, once the real shape of a B2B deal comes into view. A single opportunity involves multiple stakeholders engaging across different channels over months, not one buyer moving through a straight line from ad to demo to close. Directive's 2026 SaaS marketing guide puts the average number of marketing and product interactions before close at fifteen to twenty, spanning organic search, paid social, product trial, and sales calls, often happening in parallel rather than in sequence. Last-click attribution, still the default in a lot of CRM reporting, routinely gets the story wrong in that environment. Directive's case study of a marketing automation company found last-click credited paid social with sixty percent of revenue, while multi-touch analysis showed organic search and product experience actually drove the majority of influence on the deal. Video sits inside that same distortion. A demo video watched at seventy percent completion three weeks before close can look, on a last-click report, like it did nothing at all.
The three integrations that have to be working before any video metric means anything
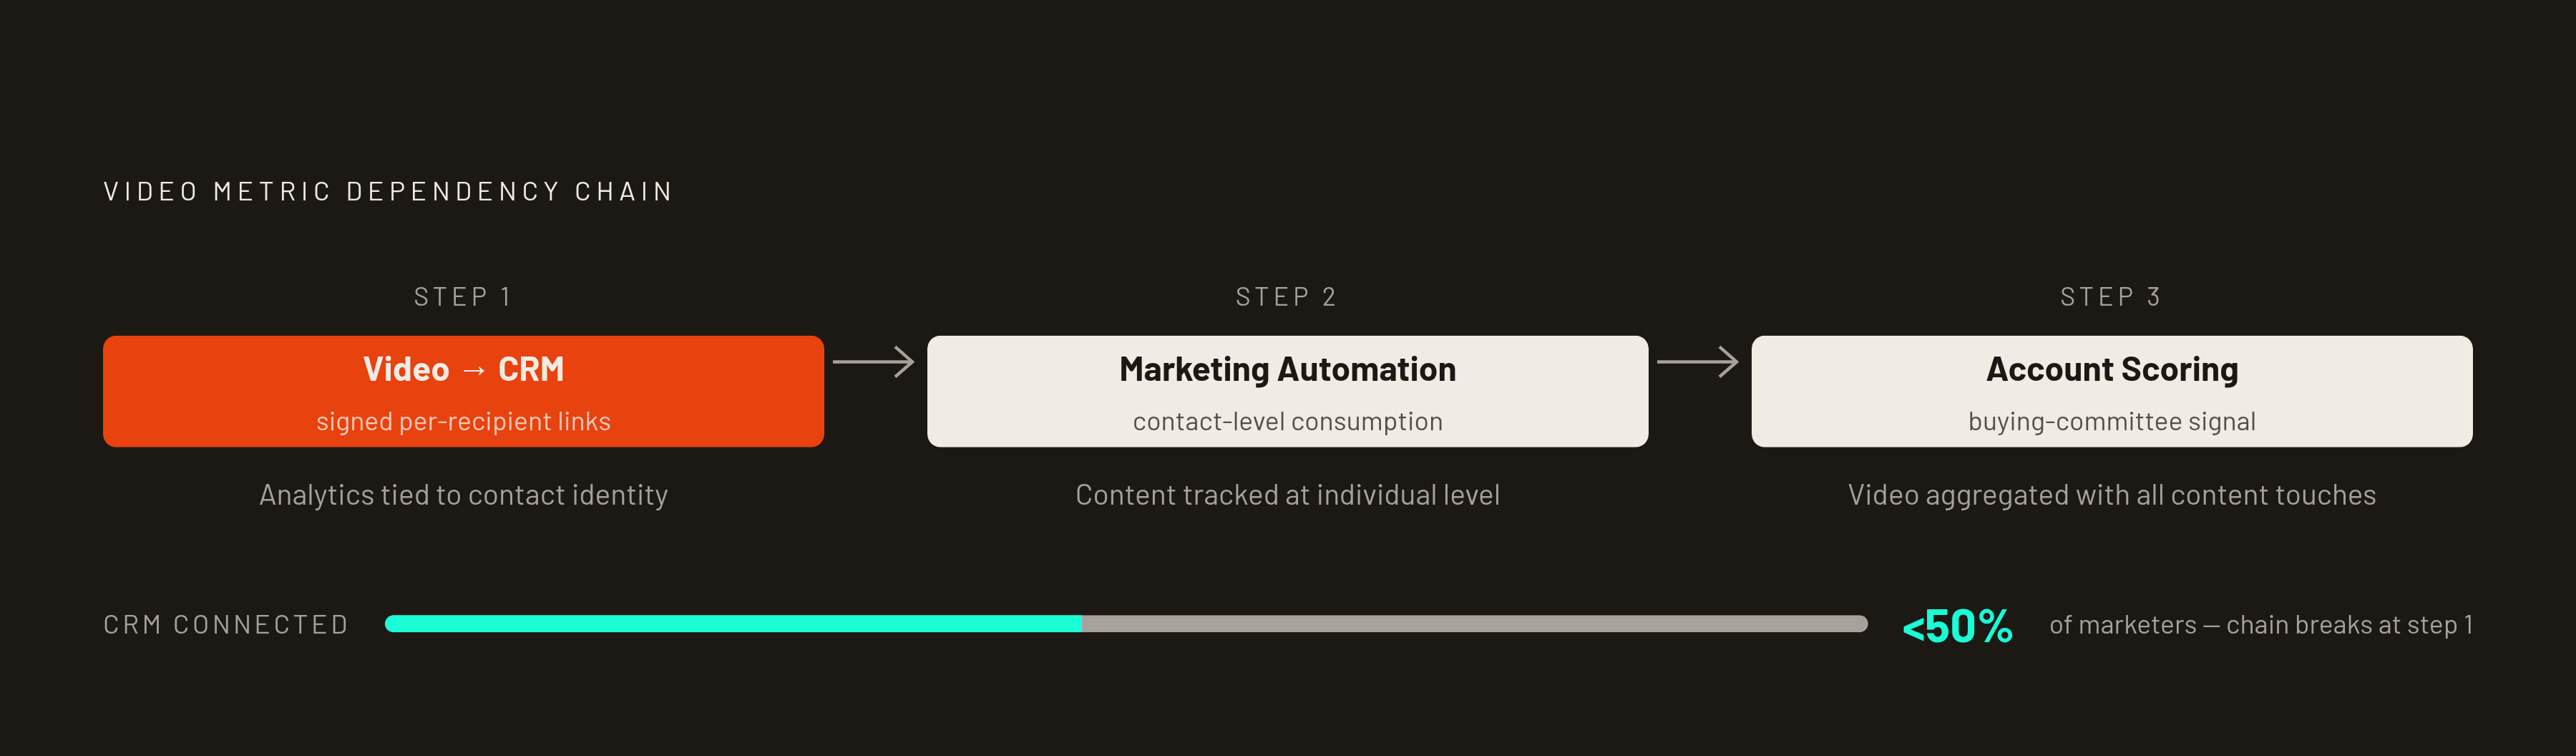
Three integrations, working together, are the prerequisite for video data that predicts pipeline: video platform analytics flowing into the CRM, marketing automation tracking content consumption at the contact level, and account engagement scoring that aggregates video alongside other content touches. Skip any one of the three and video measurement stays stuck at the engagement tier, meaning views, watch time, and completion aggregates, none of which can be tied to a named opportunity. Fewer than half of marketers currently connect their video platform to their CRM or email marketing tool at all, based on Vidyard's buyer's guide research. That single missing connection is enough to keep an entire program blind to pipeline impact, no matter how good the content is.
The technical decision that unlocks the first integration is the signed, per-recipient video link. A URL generated for one specific recipient, carrying an access token that ties every play event to that recipient's identity and expires after a set window, is what makes attribution possible at the contact level. Without that token, a video platform has no way to distinguish a champion from a bystander, which is precisely the failure described in the section above.
Most teams skip account-level scoring entirely, even after they've wired up the CRM connection. It aggregates video viewing events alongside other content touches so a buying committee's collective engagement becomes one scored signal instead of a scattered pile of individual play counts. Without it, a champion who watches a video five times and a VP who watches it once look identical in the CRM, which defeats the purpose of tracking at the contact level in the first place.
This architecture determines the choice of platform. TechBullion's analysis identifies a platform like Vidyard as purpose-built for one-to-one sales outreach video rather than aggregate marketing analytics, and frames CRM event firing as a general evaluation test applied across platforms including Vidyard, Wistia, and Gumlet. Wistia, by contrast, is positioned primarily for marketing-side pipeline attribution, with HubSpot-native CRM attribution and marketing analytics as its strongest use case. Neither is better in the abstract. The question that actually matters is architectural: which CRM events does each platform fire natively, and do those events match the scoring model already built into the account engagement layer. A platform that fires beautiful contact-level data into a CRM with no scoring model behind it produces the same blind spot as no integration at all.
Instrumenting CRM events at the threshold level
The number of distinct CRM-bound events a single video fires turns out to be a better predictor of pipeline impact than any aggregate engagement metric. Partial engagement at a named account is something a sales team can act on today. A completion rate calculated across anonymous plays offers no such signal, so the practical move is to instrument events at the threshold level rather than settle for a single completion flag.
The events worth firing as separate CRM records, each tied to the contact rather than to the video asset in aggregate, start with view start, then move through the twenty-five percent watched threshold, the fifty percent watched threshold, and the seventy-five percent watched threshold, before reaching completion. The in-player CTA click, tied to the open opportunity rather than just the contact, belongs alongside them, along with repeat viewing within an active deal window, which is a strong signal that a champion is circulating the video internally.
Collapsing all of that into a single completion flag loses exactly the signal that matters most. A prospect who watches to sixty percent and then forwards the link to a skeptical VP has shown more real buying intent than a prospect who completes a short video once and never returns. A completion-only model scores the second prospect higher, which gets the read on the deal backward. Threshold data avoids that mistake because it captures where a viewer stopped, not just whether they finished.
Completion also connects to what happens next in the funnel. Analysis connecting completion rate to downstream demo booking rates found that videos reaching seventy percent or higher completion drive substantially higher demo conversions than those falling around forty percent, because a viewer who drops off before the call to action never actually heard the positioning that drives the next step. Length is a big part of why some videos clear that bar and others don't. Benchmarks drawing on Vidyard data show videos under one minute achieving a sixty-five percent completion rate, with completion falling off sharply as length increases, and the average B2B video has compressed noticeably in recent years, a sign the market is already correcting toward formats people actually finish. None of that is a production tip dropped in for its own sake. Shorter videos are easier to instrument meaningfully, because more viewers actually reach the seventy-five percent and completion thresholds where the signal lives.
The five metrics that correlate with pipeline, and the ones that don't
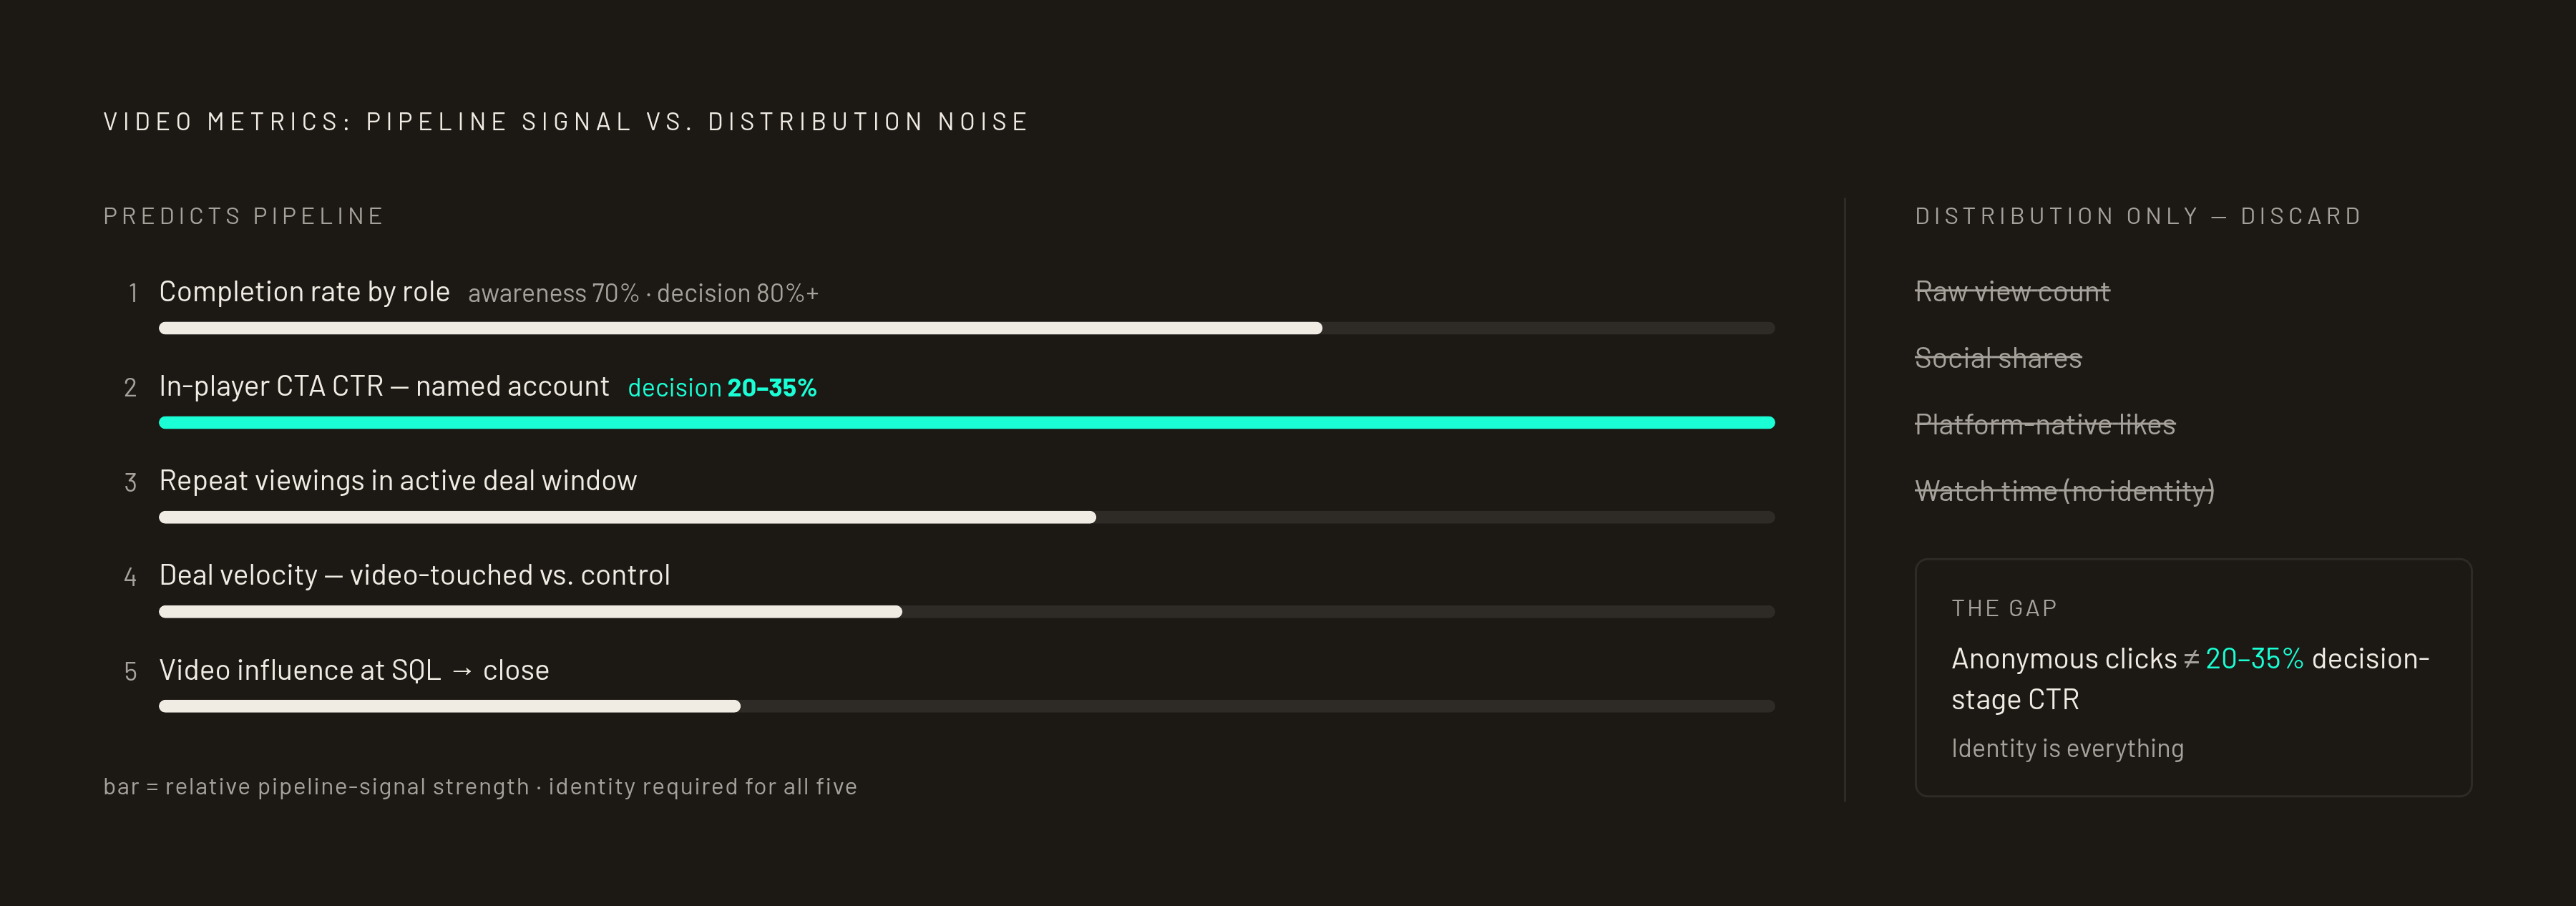
Raw view count and social shares don't predict pipeline, because neither one can be tied to a specific opportunity. Every metric that does correlate with pipeline is some variation of CRM-bound engagement by a named account at a moment that actually matters in the deal. Five metrics, built on CRM-integrated attribution data, do the real work here.
Completion rate segmented by buying-committee role is the first. Completion by a technical evaluator means something different from completion by an economic buyer, and an aggregate rate can hide a deal that's actually at risk behind a number that looks fine on average. Segmented targets run higher for later-stage content: awareness material should clear seventy percent completion, and decision-stage content should clear eighty percent or higher. A decision-stage video sitting at fifty percent completion for an economic buyer is a warning sign that would be invisible in a blended number.
In-player CTA click-through rate tied to a named account is the second, and it works because identity changes what the click means. A CTA click from an anonymous session is weak evidence of anything. The same click from a known contact at an account with an open opportunity functions as a real sales alert. Benchmarks for demo booking rate from video track this by funnel stage: awareness content should drive five to eight percent, consideration content twelve to eighteen percent, and decision content twenty to thirty-five percent. A rep who sees that click come in from a named contact has a reason to call within the hour instead of waiting for the weekly report.
Repeat viewings within an active deal window are the third, catching what aggregate view counts erase: a champion reviewing the same video multiple times, or a new stakeholder watching it days after the first contact was made. Vidyard's 2025 Future of Revenue Report found that more than a third of teams using video report higher win rates, with other cohorts reporting increased pipeline volume and shorter deal cycles, a pattern consistent with video doing real work at exactly these repeat-viewing moments.
Deal velocity for video-touched opportunities against a control group is the fourth. The comparison that matters is average close time for prospects who watched a specific video against those who didn't. The gap between those two numbers is the metric worth tracking; the absolute length of the cycle matters less.
Video influence on opportunity-to-close stage: tracking whether video touches appear in the activity history of won versus lost deals at the SQL-to-opportunity and opportunity-to-close stages identifies which assets are doing work at the point where deals are won or lost. That stage carries outsized weight for a structural reason. Funnel benchmarking work shows MQL-to-SQL as the stage with the most leverage for improvement, where a lift produces the fastest revenue gains of anywhere in the funnel, which makes video attribution at that stage the highest-value measurement target in the entire program.
Everything left out of this list belongs somewhere else. Aggregate play counts, social shares, platform-native likes, and total watch time with no contact identity attached can live in a distribution dashboard if a team wants to track reach.
Mapping video assets to where deals stall
Once attribution is actually working, the CRM becomes the content brief itself, generated directly from pipeline data rather than compiled as a report. The video most likely to move pipeline is the one that addresses the objection killing the most deals right now, and that information already exists inside closed-lost data and call notes. Funnel-stage mapping, sorting content into awareness, consideration, and decision buckets, is table stakes at this point. A framework that starts with a team's own closed-lost data produces a much higher-leverage brief. The process is direct: pull the last twenty closed-won and twenty closed-lost deals, then identify where each one sat longest and what came up repeatedly in call notes or CRM activity logs. That exercise produces the actual content brief, and it is almost never identical to a generic top-of-funnel, middle-of-funnel, bottom-of-funnel template.
Three patterns appear often enough to serve as starting points, drawn from TechBullion's analysis. When a deal stalls at technical review, it usually needs a specific architecture or security walkthrough instead of a longer version of the general product overview. Deals lost to implementation confidence need a video showing the actual onboarding process, with a real timeline attached, rather than a reassurance that onboarding is easy. Deals that go quiet after a proposal need a decision-stage asset built specifically for a stakeholder who never joined a call, something a champion can forward internally without a sales rep in the room to narrate it.
The buying committee makes all of this more specific still. A B2B SaaS buying committee for a single deal can run to six to ten distinct roles, and each one needs a different cut of the same proof instead of a longer version of the same explainer. Role-specific content gaps are flagged as a common pitfall for exactly this reason: a product manager evaluating integrations and a VP approving budget need different content entirely, and treating them the same loses both of them. The CRM data from the closed-won and closed-lost review will usually show which role is stalling a given deal. That's the role the next video needs to be built for.
Where multi-touch attribution breaks down in high-ACV SaaS
Multi-touch attribution fixes the obvious flaw in last-click reporting, where all the credit lands on whichever touchpoint happened right before close. It introduces a different problem in high-ACV SaaS. Long sales cycles, buying committee complexity, delayed conversions, and under-credited brand touches combine to make clean fractional credit across many months of buyer activity nearly impossible to assign. A prospect might see a display ad, attend a webinar, read several blog posts, hear about the product from a colleague, watch a demo video twice, and sit through four sales calls before signing. Splitting credit evenly, or by any fixed weighting formula, across touches that different in kind and timing produces a number that looks precise and means very little.
The honest response to that limitation is not to abandon attribution. It's to lower the ambition of what attribution is being asked to do. Rather than assigning fractional revenue credit across every touch in an eighteen-month cycle, the CRM-bound event data described earlier in this piece asks a narrower, answerable question: did this specific account engage with this specific video at this specific stage, and did that engagement precede movement to the next stage. That's a claim about sequence and correlation, not a claim about exact revenue share, and it holds up under scrutiny in a way that a precise-looking multi-touch percentage often doesn't.
For a high-ACV SaaS team, that means treating video's role in the deal as one input to a stage-based read, a smaller claim than a formula that promises to explain a closed six-figure contract with a decimal-point breakdown. That's a smaller claim than pure multi-touch attribution tries to make, and it's the one the data can actually support.